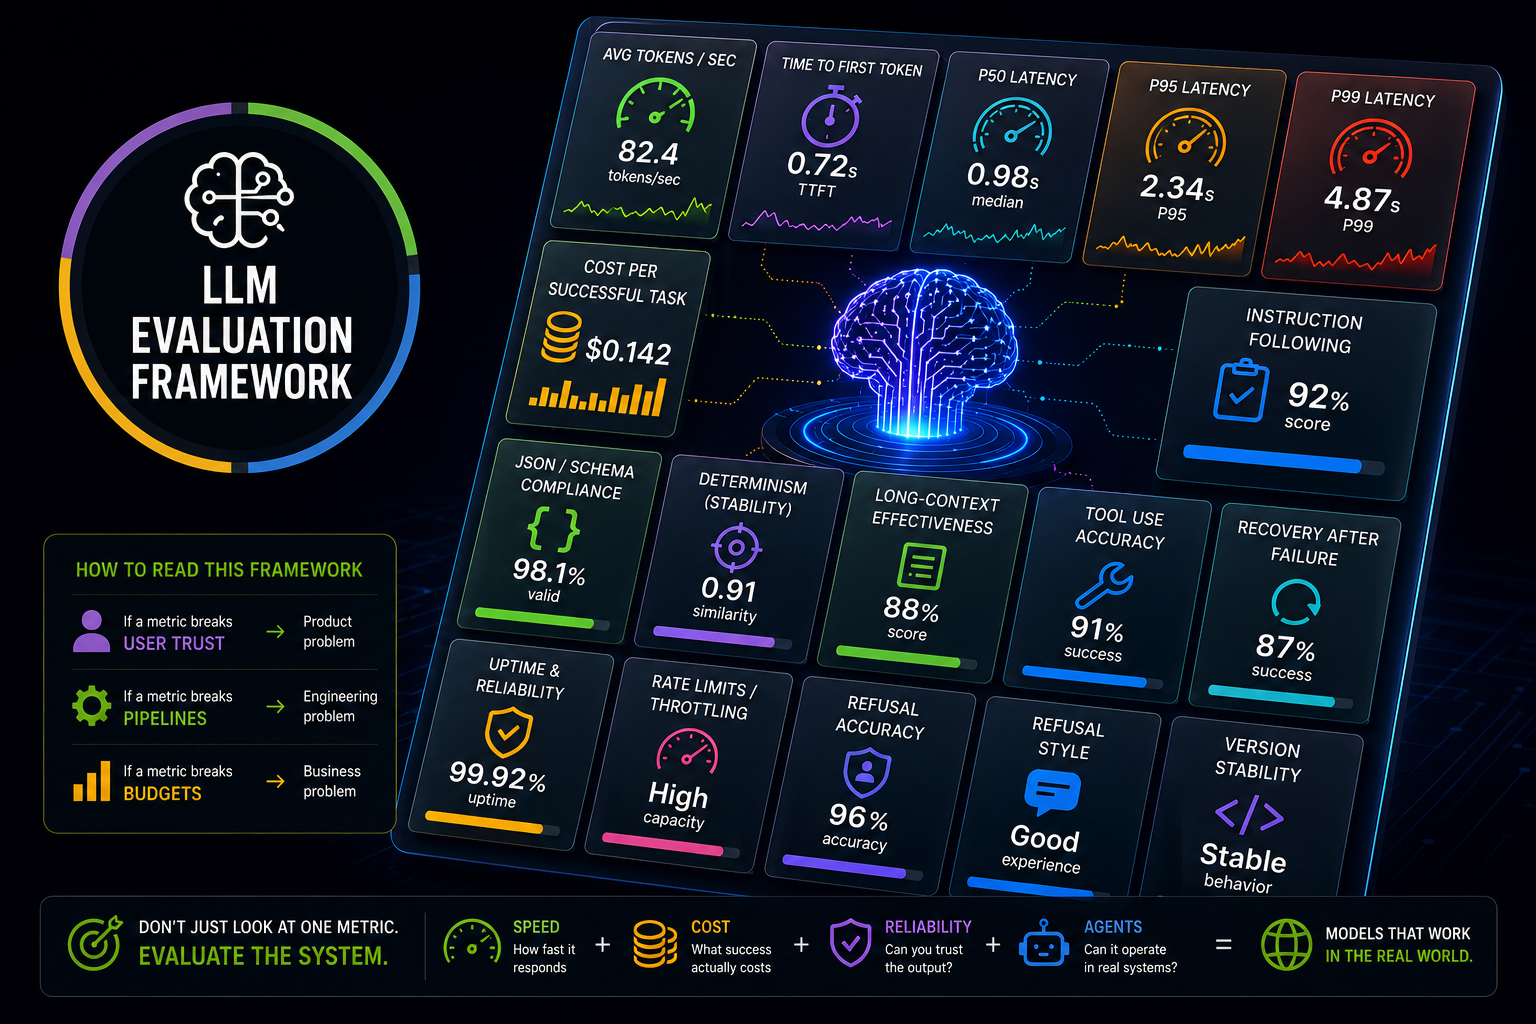

✨ Key Takeaways
This article shifts the focus of LLM evaluation from simple speed benchmarks to production-ready reliability. It argues that while tokens per second look good on paper, true success depends on latency distribution, instruction following, and the total cost of successful task completion.
Look Beyond Throughput — Average tokens per second (Avg t/s) only measures output speed; it fails to account for silence before responding or the actual usability of the generated text.
Prioritize Human Experience — Time to First Token (TTFT) is critical for user experience, as long delays before the first word appears make a system feel broken regardless of its final speed.
Analyze Latency Distribution — Averages hide failures; monitoring P95 and P99 latency is essential to ensure that worst-case delays don't cause agentic loops to stall or costs to spike.
Calculate Cost per Success — True cost is not just price per token, but the total expense of completing a task including necessary retries, validations, and fallback model usage.
Value Reliability over Volume — Instruction following, JSON correctness, and deterministic behavior are more important for production systems than large context windows or high-speed benchmarks.
Reading time: 5 minutes · Audience: AI product managers, developers moving LLMs into production, and technical decision-makers. · Level: Intermediate
Disclaimer: This article is not about helping you choose the right LLM for your specific use case. Its purpose is to explain the metrics you should be comparing when making that decision. Once you understand what these metrics mean, you can ask ChatGPT, Claude, Gemini, Perplexity, Artificial Analysis, OpenRouter, or any benchmarking tool to provide the latest numbers for the models you’re evaluating. The goal is not to tell you which model wins, but to help you understand what game is being played and which scoreboards actually matter.
So…
We keep judging LLMs like football teams by goals scored.
Fast model.
High tokens per second.
Looks great on the scoreboard.
But even in football, goals are not everything.
What’s the value of scoring if:
your star player gets injured every second match?
your coach loses the locker room halfway through the season?
you score once… but concede twice?
your defense collapses under pressure?
No serious club is built on goals alone.
Yet in AI, we keep doing exactly that.
We look at average tokens per second and crown winners, as if we’re watching highlights — not running a full season.
That’s where the comparison should stop.
Because once LLMs move from demos to production, they stop being highlights — and start behaving like infrastructure.
Everyone compares models by speed.
Here’s why that’s the wrong starting point.
Most model comparisons stop at Avg tokens per second.
Fast model wins.
Slow model loses.
That works well for tweets.
It works terribly for products.
Once an LLM enters a real system, speed becomes just one variable among many failure points.
Let’s go through the metrics that actually decide whether a model survives in production.
1. Average tokens per second (Avg t/s)
This is the metric everyone knows.
What it measures
How many tokens a model can generate per second after it has started responding.
Why it matters
Faster streaming responses feel better
High throughput helps with scale
Batch jobs complete sooner
What it does not tell you
How long the model stays silent before responding
Whether the output is usable
Whether the model breaks mid-response
Avg t/s is output speed — not user experience.
2. Time to First Token (TTFT)
This is the metric users feel immediately.
What it measures
The time between sending a prompt and receiving the first token of output.
Why it matters
Silence feels like failure
Streaming UX lives or dies here
Users judge responsiveness before quality
Two models can have identical Avg t/s.
One feels instant.
The other feels broken.
3. Latency distribution (P50 / P95 / P99)
Averages hide problems.
What these metrics measure
P50 (median): the typical experience
P95: the slowest experience for 5% of requests
P99: worst-case behavior
Why this matters
LLMs do not run in isolation.
They run:
in chains
with retries
under concurrency
inside agents
When P95 or P99 latency spikes:
agents stall
queues build
costs rise
trust erodes
Nothing crashes.
The system just becomes unreliable.
4. Cost per successful task
Most pricing discussions are misleading.
What people usually look at
Cost per input token
Cost per output token
What actually matters
How much does it cost to complete one task successfully?
A real task includes:
retries
validation
fallback models
hallucination cleanup
A cheap model that fails often is not cheap.
5. Instruction following & constraint adherence
This is where many systems fail silently.
What it measures
Respect for constraints
Format adherence
JSON correctness
Tool-call accuracy
Most production failures are not wrong answers.
They are almost correct outputs.
Smart but sloppy models break pipelines.
6. Determinism & output stability
Same prompt.
Same context.
Same settings.
Do you get the same structure and behavior?
Why this matters
Debugging
QA
Auditing
Trust
High variance makes systems unpredictable.
7. Long-context effectiveness
Big context windows are easy to advertise.
What actually matters
Can the model reason across long inputs?
Does attention degrade?
Does it focus on relevant information?
Large context without reasoning quality is just expensive memory.
8. Tool use & agent behavior
For agentic systems, this is critical.
What it measures
Correct tool selection
Correct arguments
Recovery after tool failure
Knowing when not to act
A model can reason well and still fail as an agent.
9. Safety, refusals & guardrails
Refusals are inevitable.
What matters is:
false positives
refusal style
recovery paths
Bad refusals break flows.
Good refusals preserve them.
10. Reliability & operational consistency
Often ignored. Always painful.
This includes:
uptime
rate limits
throttling
breaking updates
SDK stability
Reliability is part of model quality.
Why there is no official scoreboard
There is no governing body for LLM metrics.
No ISO.
No regulator.
No standardized benchmarks across providers.
Why?
Models evolve constantly
Infrastructure affects results
Prompts shape performance
Vendors avoid exposing weaknesses
So we rely on community-driven measurement.
Two unofficial sources worth watching
Artificial Analysis
One of the few structured attempts to evaluate models as systems.
They track:
speed
latency
cost
benchmark performance
Not perfect.
But consistent and transparent.
OpenRouter
A routing layer that exposes real-world behavior.
Because it sits between:
users
workloads
multiple providers
It reveals tradeoffs you only see in production.
Final thought
Average tokens per second is not useless.
It’s just incomplete.
If you’re building real products, the real question is not:
Which model is the fastest?
It's:
Which model behaves predictably when things are not ideal?
Growth has never been about picking the best tool.
It’s about understanding the trade-offs before they hurt you.